- C# .NET
- Introduction to .NET Framework
- Applications of .NET, Before .NET
- .NET Advantages, .NET (vs) Java, .NET Framework in-depth
- .NET Framework Architecture, Assemblies and MSIL in-depth
- Run Time Execution Environment, Components of CLR, FCL Architecture
- Getting Started with Visual Studio , Visual Studio IDE
- C# Introduction
- Keywords, I/O Statements, Comments
- Data Types, Variables, Type Casting
- Object class methods, Scope of Variables, Operators, Control Statements
- Enumerations and Arrays
- Main() method in-depth
- Classes and Objects, Creating own classes
- Parameters and Method Overloading
- Properties
- Constructors and Destructors
- Structs
- Partial Classes and Static Classes
- Introduction to Inheritance, Visibility Modifiers and Simple Inheritance
- Hierarchical, Multi-Level and Hybrid Inheritance
- Hiding methods, Method Overriding, Abstract Classes and Methods
- Sealed Classes and Interfaces
- Delegates
- Array Class
- Strings
- DateTime and Random Classes
- Generics
- Collections
- LINQ
- Exceptions
- Debugging, Break points, Immediate window
- Multi Threading
- Multi Threading
- Assemblies
- Assemblies
- Manipulating Drives
- Manipulating Folders
- Manipulating Files and File Streams
- Application Configuration
Debugging
Bug: An error.
Debugging: Removing the bugs.
.NET offers more features for debugging. To start with the .NET application debugging, you should create the break points.
Break Points
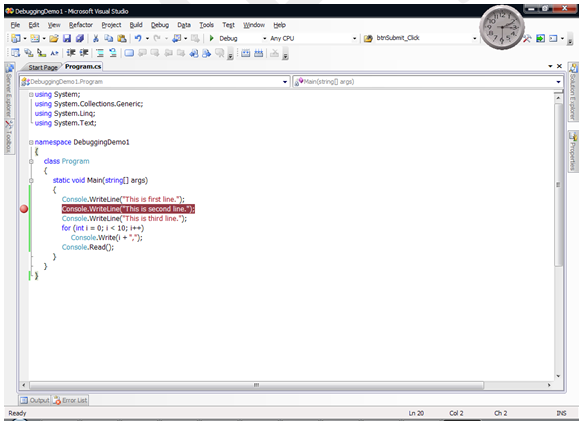
i) Definition: A break point is a point in the program, where the application execution control pauses until you press “F10” key. In the code, that line is highlighted with red color.
ii) Creating a break point: Just click on the left side margin of the required line.
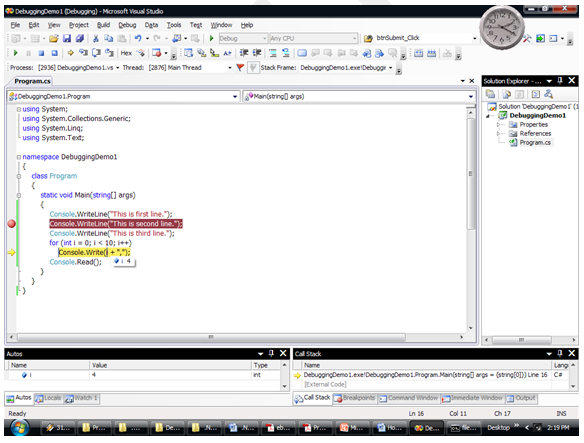
iii) Running the Application with Break Points: Just press “F5” key. The application will be executed normally. But whenever the execution control reaches to the break point line, automatically the execution will be paused and the break point line will be highlighted with yellow color. To continue with execution to the next statement, press “F10” key.
iv) Observing the values of variables or objects: While you are executing the application with break points, to know the current value of any variable or object, just place the mouse pointer over it.
Demo on Break Points
Debugging: Removing the bugs.
.NET offers more features for debugging. To start with the .NET application debugging, you should create the break points.
Break Points
i) Definition: A break point is a point in the program, where the application execution control pauses until you press “F10” key. In the code, that line is highlighted with red color.
ii) Creating a break point: Just click on the left side margin of the required line.
iii) Running the Application with Break Points: Just press “F5” key. The application will be executed normally. But whenever the execution control reaches to the break point line, automatically the execution will be paused and the break point line will be highlighted with yellow color. To continue with execution to the next statement, press “F10” key.
iv) Observing the values of variables or objects: While you are executing the application with break points, to know the current value of any variable or object, just place the mouse pointer over it.
Demo on Break Points
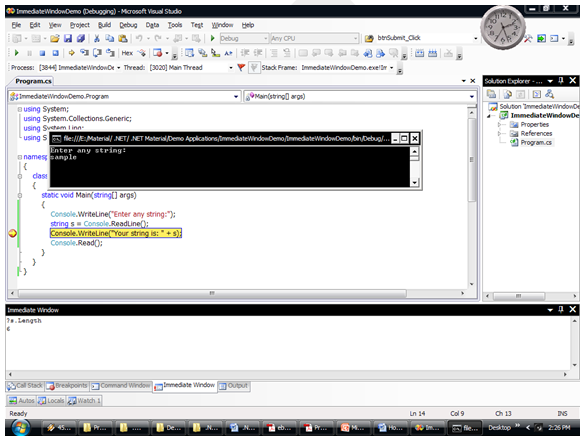
Immediate window
• The “Immediate” window resides at bottom side of Visual Studio IDE. It will automatically appear at run time. If not, press “Ctrl + Alt + I”.
• This window is used to know the current values of the required variables, objects or data members, which is not possible to find the value by just placing the mouse pointer over it
• This window is used to know the current values of the required variables, objects or data members, which is not possible to find the value by just placing the mouse pointer over it